From Shelf to Checkout to Replenishment — One Real-Time View
When your POS, e-commerce, warehouse, and promo data finally agree, merchandising, store ops, and supply chain stop reconciling exports and start acting on the same live numbers — sell-through, stockout risk, and promo ROI, all in one view.
- Sell-through, basket size, and promo ROI defined once — every region and channel reports the same way.
- Demand forecasts, live promos, and reorder triggers in one workflow — not three tools and a spreadsheet in between.
- Ask Fovea which SKUs will stock out, why sales dipped, or if a promo is worth it — plain answers, no dashboard tour.

Common Retail Data & Visibility Challenges
Sound familiar? We hear these from merchandising, store ops, and supply chain teams all the time
Disconnected POS, e-commerce, and WMS data
Your store system says 120 units sold, e-commerce shows a different trend, and the warehouse reports 95 on hand — merchandising and finance can't agree which number to act on.
Manual replenishment and export-driven alerts
Reorder triggers, markdown reports, and stock checks still depend on someone pulling exports and updating spreadsheets — by the time the alert fires, the shelf is already empty.
SKU, pricing, and transaction errors
A duplicate SKU, miscoded promotion, or negative inventory row corrupts margin reporting — and nobody catches it until the monthly close.
Inconsistent KPIs across stores and channels
One region calculates sell-through one way, another tracks basket size differently — store scorecards and board reports never reconcile.
Every role needs a different view of the same data
Store managers need conversion, buyers need category margin, executives need chain-wide trends — but everyone waits on BI to build another dashboard.
No fast answers when performance shifts
When weekend sales dip or a promo underperforms, someone opens five reports and still can't explain why before Monday's trading meeting.
What a Retail Intelligence Platform Must Deliver
You don't need another dashboard to stare at. You need merchandising, store ops, and supply chain working off the same live numbers — with a way to get answers when something shifts.
Demand forecasting & replenishment
See which SKUs are heading for a stockout while there's still time to reorder — from live POS and warehouse data, not a planning file someone's updating on Monday morning.
How retail demand forecasting works →Merchandising & omnichannel performance
Sell-through, basket size, and margin in one view — from the store shelf to the online checkout. Same definitions everywhere, so you're not reconciling regions in a spreadsheet before the trading meeting.
Retail KPIs worth tracking →Promo ROI & margin intelligence
Find out if a promo is actually working while it's still running — real lift vs. cannibalization, measured in hours. So finance and merchandising agree on what moved margin, not what looked busy in a weekly export.
Measure promo performance →AI that answers operational questions
Ask Fovea why sell-through dropped, which stores need a reorder, or whether last week's promo was worth it — plain answers from the same data behind your dashboards, no report-hopping.
Meet Fovea →What Retailers Can Do With Infoveave
Shelf to checkout to replenishment — here is how Infoveave helps at each step, and how the pieces fit together.
POS, e-commerce, loyalty, WMS, supplier portals — retail data lives in a lot of places. Infoveave pulls it into one live source so merchandising, store ops, and finance stop arguing about whose numbers are right.
- Connect POS, Shopify/Magento, WMS, loyalty and supplier data without custom ETL
- Close the gap between store, online, and warehouse reporting
- Sales, inventory, and customer data synced across channels as it happens
E-Commerce Retailer Strengthens KPI Reliability with Data Quality Validation
“With Infoveave, our KPIs are now validated at source — our e-commerce reporting is consistent and trustworthy across every channel.”
Data Analytics Lead, E-Commerce Retailer
See what your retail data looks like when it's actually unified
This is what it looks like when POS, inventory, and sales data actually talk to each other.
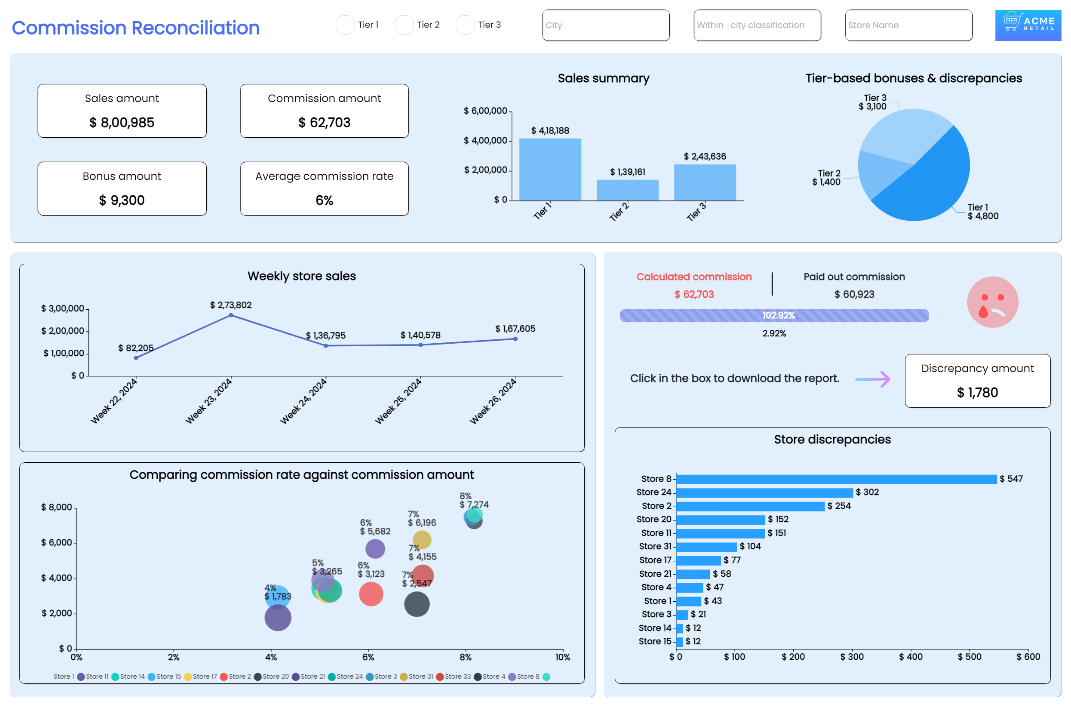
Want to see your retail data in here?
Book a short walkthrough — we will show you live dashboards built from POS, inventory, and customer data.
Stay on Top of Every Retail KPI with Infoveave
Connect your POS, e-commerce, and WMS data — then track the numbers that actually matter, updating in real time.
Gross Profit Margin
Every point of margin lost to poor pricing, promo leakage, or supplier cost creep shows up here first — before the monthly P&L review.
Gross Profit Margin = ((Net sales - Cost of goods sold) / Net sales) x 100
Net Promoter Score
The loyalty signal that predicts repeat visits — a slipping NPS means customers are shopping elsewhere even if today's sales still look fine.
Net Promoter Score = Percentage of promoters – Percentage of detractors
Inventory Turnover Ratio
How fast are you moving stock through the business? Low turnover ties up working capital and usually means the buy was too heavy or demand was misread.
Inventory Turnover Ratio = Cost of goods sold / Average inventory
Average Order Value
Every basket tells you whether merchandising and attach-rate strategies are working — flat AOV on rising footfall still means you're leaving revenue on the table.
Average Order Value = Sales / Number of orders
Sell Through Rate
The fastest read on whether your buy was right — too low and markdown season starts early.
Sell Through Rate = (Total units sold / Beginning inventory) x 100
Customer Satisfaction Score
Catches service friction at the register, on the floor, and in fulfilment before it turns into returns, complaints, and lost repeat business.
CSAT Score = (Number of satisfied customers / Number of respondents)
Shelf to checkout to replenishment — fully in view, fully in control.
Connect your POS, e-commerce, and WMS data — then track the numbers that actually matter, updating in real time.


Unify Data
Plug POS, e-commerce, WMS, and suppliers into one data layer. Merchandising, store ops, and supply chain work off the same live numbers — not yesterday's export.

Clarify Insights
Turn sales, inventory, and promo data into signals worth acting on — stockout risk, margin erosion, weak promos, basket-size drops — without someone building the report first.

Activate Decisions
When the signal is clear, act on it. Fire reorder alerts, flag markdowns, adjust staffing by store — everyone working from the same picture.
Marketplace Visibility
Pull marketplace, campaign, and regional sales into one view. See which products and promos are actually moving — and which look busy on paper but aren't converting.
Product Performance Analysis
Slice sales by department, category, and week. Spot what's selling through, what's sitting, and run discount scenarios before you commit to a markdown.
Product Pricing Optimization
Compare your prices against cost, history, and competitor moves. Test changes on unified data before they go live — so margin doesn't surprise you after the fact.
New Merchandise Planning
Model new bundles, promos, and assortments before they hit the floor. Plan buys against what customers are actually buying, not last season's spreadsheet.
Revenue Assurance
Catch pricing mismatches, SKU drop-offs, and unusual transaction patterns before they become a revenue leak. Investigate when numbers look off — not after close.
Shipment & Logistics Optimization
Track shipments from DC to store with delivery data connected in. Spot late lanes, cost overruns, and reconciliation gaps before they compound.
Stop reconciling. Start trading.
Shelf, checkout, and replenishment on one platform — with Fovea when you need a fast answer.
Frequently Asked Questions
Ready to see Infoveave in action?